KALISPELL CLIMATE
National Weather Service
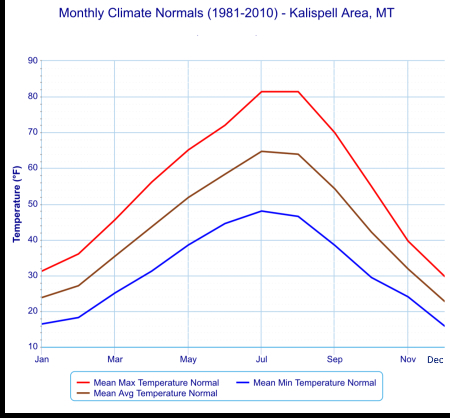
Climate represents average weather data collected over decades. After viewing the data in this table, you can get a general idea of the kind of weather you might expect when you visit this city in a particular month of the year.
From day-to-day, hour-to-hour, temperatures can vary a lot. It’s likely that you will experience close to the mean maximum high and mean minimum low. The mean average temperature for the month is a useful way to view this city’s temperature, as well.
| Month | Total Precipitation Normal (inches) | Mean Max Temperature Normal (°F) | Mean Min Temperature Normal (°F) | Mean Avg Temperature Normal (°F) |
| Jan | 1.33 | 31.2 | 16.4 | 23.8 |
| Feb | 0.97 | 36.0 | 18.2 | 27.1 |
| Mar | 1.09 | 45.6 | 25.1 | 35.4 |
| Apr | 1.24 | 56.1 | 31.2 | 43.6 |
| May | 1.98 | 65.1 | 38.5 | 51.8 |
| Jun | 2.56 | 72.0 | 44.5 | 58.3 |
| July | 1.45 | 81.4 | 48.0 | 64.7 |
| Aug | 0.99 | 81.4 | 46.5 | 63.9 |
| Sep | 1.38 | 69.9 | 38.4 | 54.2 |
| Oct | 1.01 | 54.9 | 29.4 | 42.1 |
| Nov | 1.43 | 39.6 | 24.0 | 31.8 |
| Dec | 1.56 | 29.7 | 15.8 | 22.7 |
| Annual | 16.99 | 55.2 | 31.3 | 43.3 |

Be inspired to visit the Treasure State, a song to listen to: “Montana On My Mind” by Scioto River Band and Catherine Leigh (MTbest). Download the song on iTunes.

Absaroka Mountain, Mont.
© 2021 John Sandy

